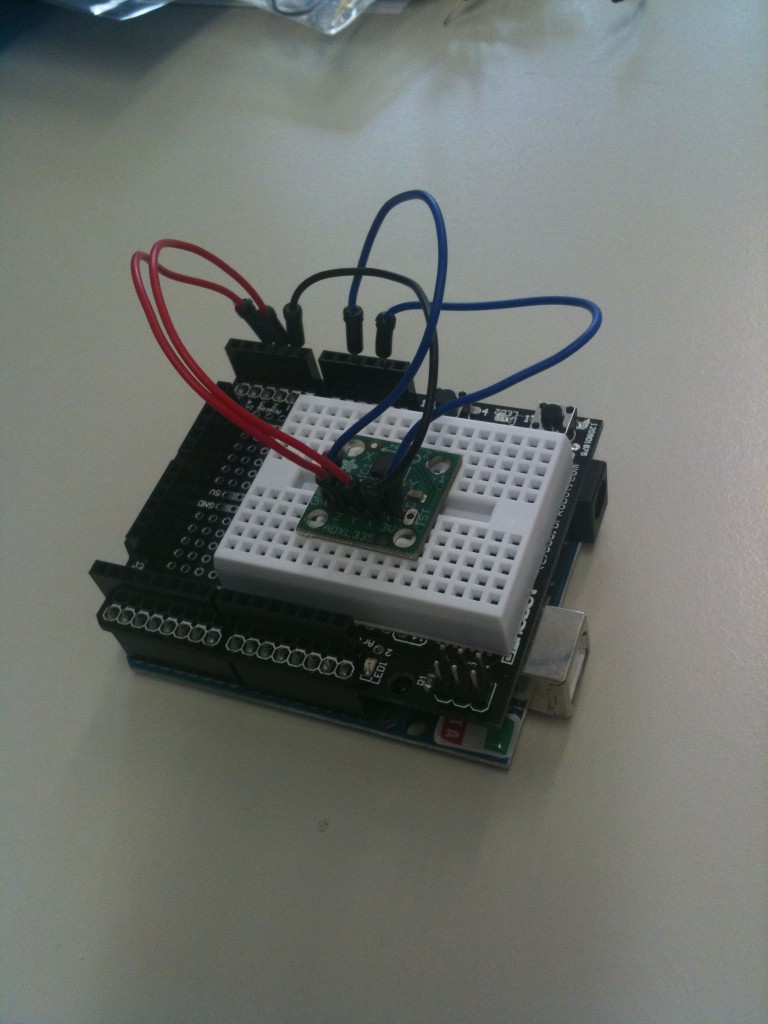
One of the most important things in the robot design is the possibility to check and control the values feeded by the analogic sensors, i.e. accelerometers, gyros, IR sensors.
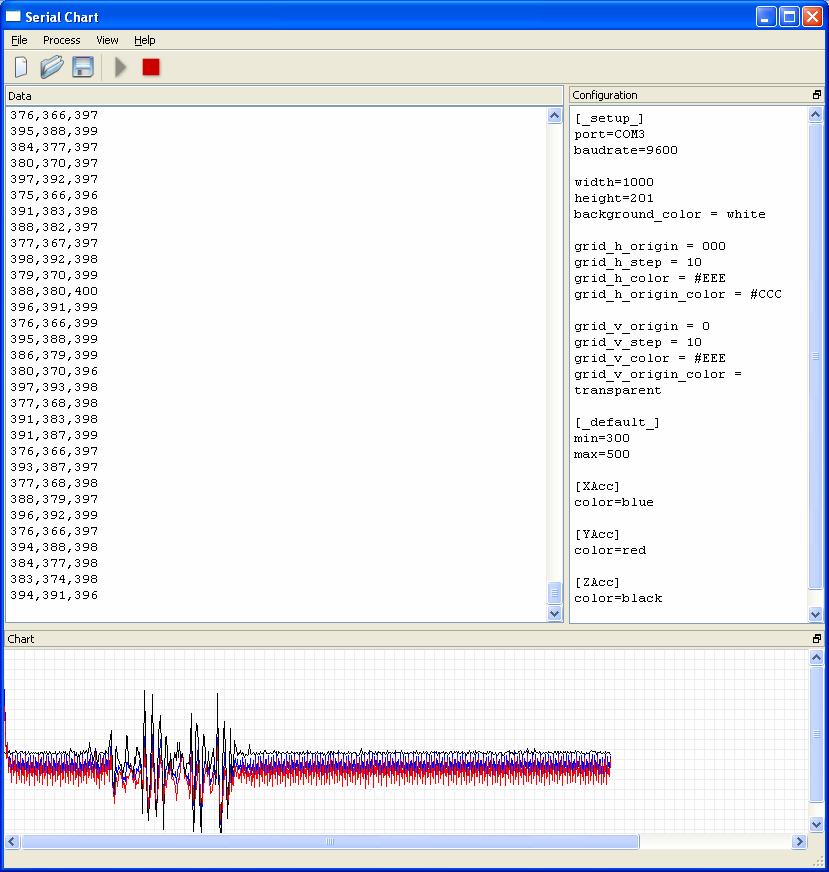
In order to view the sensor values you can use the Serial Port that can be displayed in the Serial Monitor inside the Arduino IDE environment.
But it isn’t possible to show charts or save the data read from the sensors.
There are several software that allow to show the graphs derived from the sensors data, and I published in the past a tutorial (here).
Usually you use Processing or similar language that require always to write some code. You have to write code to change the charts or to implement new lines in the graphs.
I thought that the ideal situation would be to use a software that everyone knows: Microsoft Excel.
If it were possible to use Excel to receive the data from the serial port, it would be easy to make very nice and user friendly charts.
I searched in Google and i found a sw that allows easily to view the serial port values in Excel.
The sw is made by a competitor of Arduino, Parallax, the company that sells the Boe-Bot and the Propeller, wich are in direct competition with Arduino.
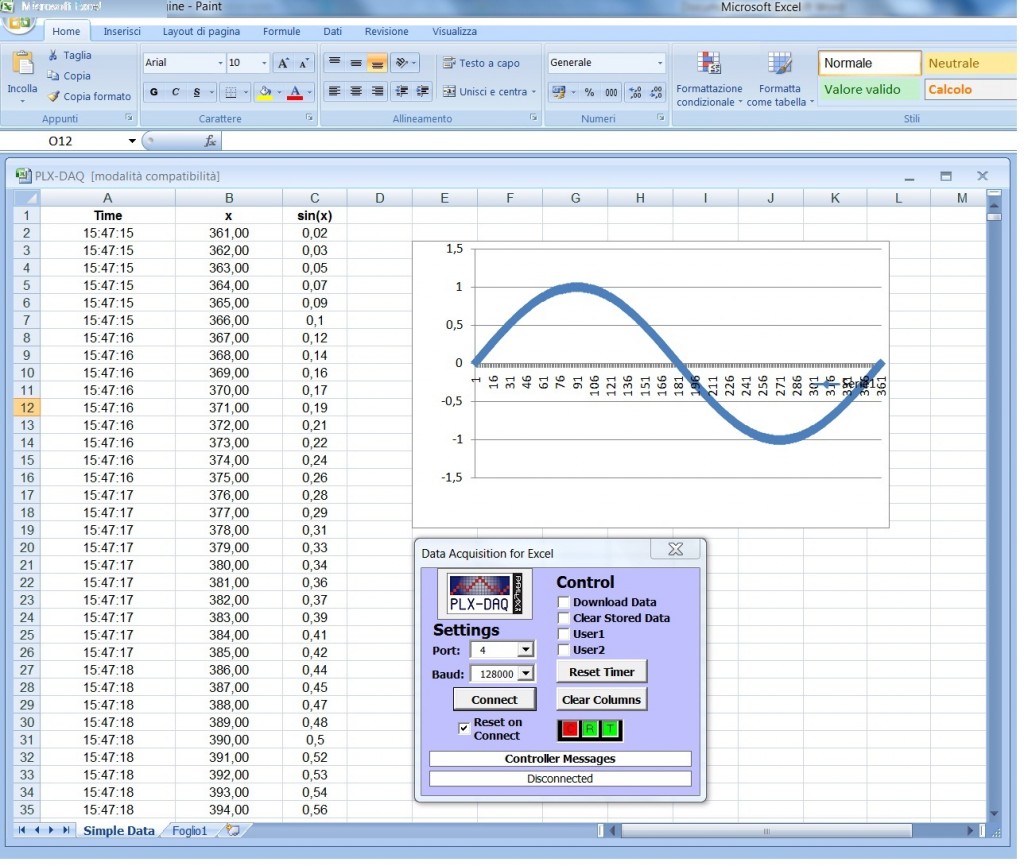
The sw is called PLX-DAQ and it is a free software. You can download it here. It works only in Windows, sorry.
In practice it is a little sw in VBA that adds some features to Excel to receive and elaborate real time data. If the data are in Excel it is also possible to save them in a file and it is possible to use the amazing function library already present in the spreadsheet software. The documentation about PLX-DAQ is complete and clear.
The PLX-DAQ takes commands in uppercase and every data row have to end with a ‘carriage return’. The serial port speed required by PLX-DAQ is particular, because it derives from Parallax world. In any case the rate is from 9600 bit/sec to 128.000 bit/sec. The speed of 128.000 bit/sec works fine in the Arduino!!
The main commands are:
- LABEL used to define the column headings. The command format is: Serial.println (“LABEL, INT_COLUMN”);
- DATE, TIME that allows the serial port to send data to Excel. The first field is always TIME, then the fields of interest (val). The command format is: Serial. print (“DATE, TIME,”); Serial.println (val)
- ROW, SET, k, allows you to define the next line to write. It is useful if you want to plot n data and then go back to first row and cycle. For example, you can plot 1000 data on the chart and then start again from the first position, in order to avoid a graph too large. The command format is: Serial.println (ROW, SET, 2) put the cursor in the second line next step.
Here’s an example that shows Excel function sin (x).
The Arduino code:
int x = 0;
int row = 0;
void setup() {
  Serial.begin(128000); // opens serial port, sets data rate to 128000 bps
  Serial.println("CLEARDATA");
  Serial.println("LABEL,Time,x,sin(x)");
}

void loop() {
  Serial.print("DATA,TIME,"); Serial.print(x); Serial.print(","); Serial.println(sin(x*PI/180));
  row++;
  x++;
  if (row > 360)
   {
    row=0;
    Serial.println("ROW,SET,2");
   }
  delay(100);
}
PLX-DAQ enable a more complex interaction with Excel. It can take the cell values from Excel, it can read and write check box. You can see the PLX-DAW documentation for other details.


